- Research
- Open access
- Published:
Omics analysis coupled with gene editing revealed potential transporters and regulators related to levoglucosan metabolism efficiency of the engineered Escherichia coli
Biotechnology for Biofuels and Bioproducts volume 15, Article number: 2 (2022)
Abstract
Background
Bioconversion of levoglucosan, a promising sugar derived from the pyrolysis of lignocellulose, into biofuels and chemicals can reduce our dependence on fossil-based raw materials. However, this bioconversion process in microbial strains is challenging due to the lack of catalytic enzyme relevant to levoglucosan metabolism, narrow production ranges of the native strains, poor cellular transport rate of levoglucosan, and inhibition of levoglucosan metabolism by other sugars co-existing in the lignocellulose pyrolysate. The heterologous expression of eukaryotic levoglucosan kinase gene in suitable microbial hosts like Escherichia coli could overcome the first two challenges to some extent; however, no research has been dedicated to resolving the last two issues till now.
Results
Aiming to resolve the two unsolved problems, we revealed that seven ABC transporters (XylF, MalE, UgpB, UgpC, YtfQ, YphF, and MglA), three MFS transporters (KgtP, GntT, and ActP), and seven regulatory proteins (GalS, MhpR, YkgD, Rsd, Ybl162, MalM, and IraP) in the previously engineered levoglucosan-utilizing and ethanol-producing E. coli LGE2 were induced upon exposure to levoglucosan using comparative proteomics technique, indicating these transporters and regulators were involved in the transport and metabolic regulation of levoglucosan. The proteomics results were further verified by transcriptional analysis of 16 randomly selected genes. Subsequent gene knockout and complementation tests revealed that ABC transporter XylF was likely to be a levoglucosan transporter. Molecular docking showed that levoglucosan can bind to the active pocket of XylF by seven H-bonds with relatively strong strength.
Conclusion
This study focusing on the omics discrepancies between the utilization of levoglucosan and non-levoglucosan sugar, could provide better understanding of levoglucosan transport and metabolism mechanisms by identifying the transporters and regulators related to the uptake and regulation of levoglucosan metabolism. The protein database generated from this study could be used for further screening and characterization of the transporter(s) and regulator(s) for downstream enzymatic/genetic engineering work, thereby facilitating more efficient microbial utilization of levoglucosan for biofuels and chemicals production in future.
Background
The increasing concerns on global energy crisis and climate change have prompted the development of renewable and sustainable resources for biofuels and chemicals production as an alternative to traditional fossil-based fuels and chemicals. Lignocellulosic biomass, as the most abundant and non-food-oriented resource generated from solar energy and carbon dioxide fixation on our planet, is environment-friendly and renewable, and has been researched extensively in past decades [1]. However, it is still somewhat problematic for the efficient utilization of lignocellulosic biomass, which requires two main steps: (1) depolymerization of the lignocellulose into fermentable sugars by pretreatment procedures and (2) bioconversion of sugars by microbial fermentation. One of the major challenges involved in this conversion process is the lack of fermentative microorganisms that could effectively utilize the non-glucose lignocellulose-derived substrates, such as levoglucosan [2].
Levoglucosan is an abundant sugar present in the lignocellulosic pyrolysate produced by pyrolysis technique [3], which takes the lowest capital cost among all the biomass pretreatment processes [4]. Therefore, levoglucosan is considered a promising renewable resource for producing biofuels and chemicals. In nature, a few native microorganisms could metabolize levoglucosan [3, 5,6,7,8,9,10]; however, their productions with narrow range and low value greatly limit their application as the fermenting strains to produce valuable products. Eukaryotic levoglucosan kinase (LGK) from fungi and yeast [6, 8, 9] and prokaryotic levoglucosan dehydrogenase (LGDH) from bacteria [10, 11] were found responsible for levoglucosan assimilation, thereby laying the foundation for the downstream engineering work on targeted bioconversion of levoglucosan. Recently, LGK catalyzing the phosphorylation of levoglucosan found in Lipomyces starkeyi YZ215 was cloned [12] and heterologously expressed in some platform bacteria to produce various biofuels and chemicals [13,14,15,16,17]. Nevertheless, the poorly known transmembrane transport of levoglucosan, which is the first key limiting step for microbial utilization of levoglucosan, could limit the downstream pathway flux to a great extent [15, 18], resulting in a longer lag phase and lower product productivity during levoglucosan fermentation than glucose [16] and fructose [17] fermentations. In addition, during biomass pyrolysis, a maximum of 2.9 wt% fructose can be coproduced with levoglucosan [3]. Levoglucosan metabolism is severely repressed by other carbon sources like glucose and fructose [17, 19] through the carbon catabolite repression (CCR) effect, which allows cells utilize the most energy-efficient carbon source in a sugar mixture and thus leads to a diauxic growth that limits the conversion efficiency of levoglucosan during the co-fermentation process [15, 19, 20]. Therefore, understanding and revealing the proteins related to the transport and CCR of levoglucosan are crucial for enhancing the levoglucosan conversion efficiency and cell growth rate.
Global proteomics has shown promise for the discovery of proteins with currently unrecognized functions [21]. With regard to the cells exposed to different physiological cues, comparative proteomics can serve as a unique and informative “readout” of two different physiological states, enabling the unraveling of the molecular mechanisms involved in a certain biological process [22]. Moreover, by providing an overview of the entire biochemical pathways, proteomics profiling can complement and extend our knowledge regarding the biological roles of proteins, especially, the newly identified differentially expressed proteins (DEPs). Hence, proteomics could help us discover the potentially crucial proteins involved in levoglucosan transport and catabolite repression, thereby aiding enzyme and metabolic engineering to facilitate enhanced levoglucosan uptake and metabolism efficiency, ultimately yielding improved production of biofuels and chemicals from levoglucosan.
In this study, a previously engineered levoglucosan-utilizing ethanologenic Escherichia coli strain [17] was grown in the M9 minimal media containing either levoglucosan or fructose and harvested at both early- and mid-log phases. Comparison of the proteomics of levoglucosan-feeding cells with that of fructose-feeding cells revealed remarkable differences in the protein content of these cells. The changes in protein content of these cells might reflect a variety of proteins involved in levoglucosan transport, metabolism, and metabolic regulation. To the best of our knowledge, this is the first study focusing on the biomolecular discrepancies between the cellular metabolism of levoglucosan and another sugar and identifying proteins related to the transport and CCR of levoglucosan. The understanding of the levoglucosan transport and metabolism mechanism and the proteins involved in it could produce considerable datasets and resources to facilitate future research on efficient microbial utilization of levoglucosan for biofuels and chemicals with better yields at pilot and industrial scales.
Results and discussion
Escherichia coli is a commonly used platform microorganism that possesses native transporters and metabolism pathways for many sugar substrates, while it innately cannot utilize levoglucosan [3]. Levoglucosan can be metabolized to glucose-6-phosphate (G6P) by genetically engineered E. coli in which LGK is heterologously expressed [17]; however, by what transporters levoglucosan is transported into cell cytoplasm and by what biomolecules this transport and metabolism process is regulated, are still not clear. Thus, a global insight into the cellular proteomics changes during the uptake and consumption of levoglucosan coupled with other validation work like transcriptional analysis and gene knockout could certainly provide clues about the transport and metabolic regulation of levoglucosan, providing a theoretical basis for engineering more robust levoglucosan-utilizing strains in pyrolysis-based biorefineries.
Overview of the DEPs by COG, GO, and KEGG analysis revealed the DEPs were mainly involved in carbohydrate transport, localization, and metabolism
Our DIA (data-independent acquisition)-based quantitative proteomics results identified 2749 proteins present in all the samples (Additional file 1). Expression levels of these proteins were compared globally and shown as heatmap (Fig. 1A), which indicates that protein expression in the four samples varied significantly. All quantifiable proteins with twofolds change expression levels and Bonferroni-adjusted p value less than 0.05 were defined as DEPs. The DEPs with fold change ratio ≥ 2 were considered upregulated proteins (Table 1), whereas ≤ 0.5 were considered downregulated proteins (Table 2). The clustering of the DEPs according to the COG (Cluster of Orthologous Groups) categorization is shown in Fig. 1B. Also, Venn diagrams showing the number of shared and unique upregulated/downregulated proteins in all cases are presented in Fig. 1C, which shows 49 upregulated and 24 downregulated proteins were shared by both the early- and mid-log phases. Category distribution and enrichment clustering of the DEPs based on Gene Ontology (GO) analysis were shown in Additional file 2: Fig. S1. Pathway distribution and enrichment clustering of the DEPs based on Kyoto Encyclopedia of Genes and Genomes (KEGG) analysis were exhibited in Additional file 2: Fig. S2. The detailed GO and KEGG analysis were presented in Additional file 2: Text S1. From the COG, GO, and KEGG analysis, it is evident that the DEPs are mainly membrane proteins related to carbohydrate transport, localization, and metabolism, consistent with the fact the proteomics analysis was conducted by comparing the protein expression levels exhibited by cells fed with two different carbon substrates—levoglucosan and fructose.

Comparison of total identified proteins and differentially expressed proteins (DEPs) of fructose-feeding and levoglucosan-feeding cells. E. coli LGE2 cells were cultured at 37 °C and 150 rpm in levoglucosan- or fructose-based M9 minimal media. Fru1 and LG1 denote the cells fed with fructose and levoglucosan, respectively, were harvested at the early-log growth phase; while Fru2 and LG2 denote the cells fed with fructose and levoglucosan, respectively, were harvested at mid-log growth phase. A Heatmap analysis of the total identified proteins in all the samples, and dendrogram shows the relationship of samples in protein expression. B Heatmap analysis coupled with COG categories of the total identified proteins in all the samples. Clusters 1 represents cell wall/membrane/envelope biogenesis and cell motility; Clusters 2 represents amino acid transport and metabolism; Clusters 3 represents energy production and conversion; Clusters 4 represents nucleotide transport and metabolism; Clusters 5 represents carbohydrate transport and metabolism; Clusters 6 represents DNA replication, recombination, repair, transcription, and RNA translation, ribosomal structure and biogenesis; Clusters 7 represents lipid transport and metabolism; Clusters 8 represents inorganic ion transport and metabolism; Clusters 9 represents defense and signal transduction mechanisms; Clusters 10 represents secondary metabolites biosynthesis, transport and catabolism; Clusters 11 represents poorly characterized proteins. C Number of unique and shared DEPs in levoglucosan-feeding cells relative to fructose-feeding cells at both the early- and mid-log phases
Several carbohydrate transport-related DEPs were upregulated in response to levoglucosan uptake relative to fructose uptake
Escherichia coli has an outer membrane and an inner cytoplasmic membrane, and the space between them is periplasm. The outer membrane protein LamB (A0A140NEY2), as a sugar porin protein that specifically facilitates the passive diffusion of many carbohydrates, including trehalose, lactose, sucrose, maltose, maltodextrins and glucose, and other non-specific ion/solutes across the outer membrane [23, 24], was 2.7-fold upregulated at the early-log phase and 2.0-fold at the mid-log phase when induced by levoglucosan, indicating the role of LamB in levoglucosan transport from the ambient medium to the periplasm.
Upon entering the periplasm, sugars are further transported into the cytoplasm and phosphorylated by different mechanisms (Fig. 2). The native sugar transporters of E. coli mainly include the phosphoenolpyruvate (PEP)-dependent carbohydrate phosphotransferase system (PTS), the ATP-binding cassette (ABC) transporter, and the major facilitator superfamily (MFS) [25]. Among the differentially expressed transporter proteins, only fructose-specific FruA (A0A140N8J0) and FruB (A0A140N9Z8) that can transport and phosphorylate fructose [26] are PEP-PTS proteins, and both were downregulated by about 9.4- and 17.3-fold at the early-log phase and 21.6- and 12.0-fold at the mid-log phase, respectively. By FruA and FruB, fructose can be transported into E. coli and phosphorylated to fructose 1-phosphate (F1P) or fructose 6-phosphate (F6P) [27], which are further phosphorylated to fructose 1,6-bisphosphate (FBP) by phosphofructokinase (FruK) and metabolized by E. coli (Fig. 2). Our result that proteins FruA, FruB, and FruK (FruK is discussed in the sections below) were all downregulated in levoglucosan-based media compared to the fructose-based media at both early- and mid-log phases, is consistent with the fact that the fru operon sequentially containing the fruB, fruK, and fruA genes is induced by fructose.

The (potential) transport components and transport mechanisms of different sugars in E. coli. The enzymes in red color were upregulated during levoglucosan utilization relative to fructose utilization, while those in green color were downregulated
The ABC transporters such as XylF (A0A140N4K7), MalE (A0A140NCD0), UgpB (A0A140N4W8), UgpC (A0A140N2F0), YtfQ (A0A140NEX7), YphF (A0A140N593), and MglA (A0A140NAC2) were upregulated at both the early- and mid-log phases of levoglucosan consumption compared to those of fructose consumption (Table 1). The d-xylose ABC transporter substrate-binding protein XylF as a periplasmic binding protein is involved in the ATP-dependent high-affinity xylose uptake system [28], and in this study, it was upregulated by about 6.5- and 9.1-fold at early- and mid-log phases, respectively. MalE, as the essential periplasmic binding protein component of the maltose MalKFGE ABC transporter, is responsible for the maltose uptake and was up-regulated by about 5.1- and 10.1-fold, respectively. The glycerol 3-phosphate (G3P) ABC transporters UgpB and UgpC, galactofuranose ABC transporter YtfQ, putative sugar ABC transporter substrate-binding protein YphF, and d-galactose/d-galactoside ABC transporter MglA were upregulated by about 4.5, 2.8, 4.4, 3.0, and 2.7-fold at the early-log phase, and by about 3.4, 2.3, 5.6, 4.6, and 2.3-fold at the mid-log phase, respectively. The MFS proteins like KgtP (A0A140N8T9), GntT (A0A140N385), and ActP (A0A140SS45) were also upregulated at both phases. During levoglucosan consumption at the early- and mid-log phases, the proton-driven α-ketoglutarate transporter KgtP consisting of many transmembrane spanning segments and sugar transport domains was upregulated by about 5.5- and 6.7-fold, respectively; gluconate transporter GntT involved in the gluconate uptake system driven via d-gluconate/proton symport was upregulated by about 2.7- and 2.0-fold, respectively; ActP, an acetate/glycolate permease in the solute: sodium symporter family, was also upregulated by respective 8.7- and 6.6-fold. All these upregulated transporters might be related to levoglucosan uptake, because their expression levels were higher in the presence of levoglucosan, and it is known that most transporters can transport not only one substrate.
In the LGK-catalyzing pathway, levoglucosan is phosphorylated but not transported by the non-PTS kinase LGK [3], which was highly expressed in response to levoglucosan metabolism (more proteins involved in carbohydrate metabolism and energy production were shown in Additional file 2: Text S2); therefore, it could be assumed that, some unknown non-PTS transporters coupled with a proton motive force (H+) or a direct energy drive (ATP) (Fig. 2), might be involved in the transport of levoglucosan. Interestingly, our results experimentally indicate that all the levoglucosan-induced transporters were non-PTS ABC and MFS transporters rather than PTS transporters. Although the identified ABC and MFS transporters induced by levoglucosan have been known to be involved in the transport of other non-levoglucosan sugars (described above), it is believed that these highly induced transporters might be responsible for the transport of levoglucosan into the cell cytoplasm. In fact, many sugar transporters can transport more than one substrate. For example, apart from the PEP-PTS-dependent glucose transporter PtsG; the non-PTS-dependent galactose: H+ symporter GalP, non-PTS-dependent galactose import-related MglABC, and PEP-PTS-dependent β-glucoside-specific transporter Bgl mainly responsible for the transport of galactose, galactoside, and β-glucoside, respectively, can also transport glucose, and the PEP-PTS-dependent mannose-transport carriers ManXYZ can transport both glucose and fructose (Fig. 2). Moreover, fucose transporter FucP, and arabinose transporters AraE and AraFGH can also transport fructose and xylose, respectively. In addition, in Aspergillus nidulans, HxtB, previously considered as a glucose transporter, has been recently proved to be a major xylose transporter [29], and the monosaccharide transporter XtrD turned out to have a high affinity for xylose in A. nidulans [30]. Consequently, the levoglucosan-inducing transporters MglA, XylF, MalE, UgpB, UgpC, YtfQ, YphF, KgtP, GntT, and ActP supposed to be related to levoglucosan transport could provide a database for further screening of levoglucosan transporters, which could contribute to the development of robust levoglucosan-utilizing strains.
Most DEPs related to transcription and regulation were upregulated in response to levoglucosan metabolism relative to fructose metabolism
CCR is another bottleneck that cannot be ignored in the process of levoglucosan uptake and metabolism. The preferential utilization of the most available sugar is an adaptation of bacteria to survive in a competitive environment. However, CCR inhibits the efficient production of bioproducts in industrial fermentation by reducing the conversion efficiency of preferred secondary sugars and increasing the whole fermentation time. In E. coli, there are two dominant transcriptional regulation mechanisms involved in the CCR of carbon metabolism; one is through the crp-encoded cyclic AMP receptor protein (Crp) that regulates the initiation of carbon metabolism, and the other by the cra (fruR)-encoded catabolite repressor/activator (Cra) protein that frequently regulates carbon flux through the dominant metabolic pathways [31]. In the CCR of carbon sources, PTS forms part of the regulation network, while global and operon-specific regulations also control the CCR (Fig. 2).
In the current study, DEPs related to transcription and regulation like GalS (A0A140N9Y3), MhpR (A0A140NF20), YkgD (A0A140NDL9), Rsd (A0A140SS61), Ybl162 (A0A140N2K5), MalM (A0A140NFH4), and IraP (A0A140NB68) were all induced by levoglucosan at both phases (Tables 1 and 2). GalS, as a CRP-dependent DNA-binding transcription factor that represses transcription of the operons involved in transport and catabolism of d-galactose and can be stimulated by the addition of d-fucose [32], was upregulated by about 3.1- and 3.8-fold at respective growth phase. MhpR, as a 3-(3-hydroxyphenyl) propionic acid-dependent activator of the Pa promoter that controls the expression of the mhp catabolic gene and is essential for the binding of CRP [33], was upregulated by about 2.5- and 2.6-fold. DNA-binding and redox-regulated transcriptional activator YkgD that can be induced by oxidation of its highly conserved cysteine residues [34] was upregulated by about 11.4- and 2.5-fold, the highest average fold change value we observed among the transcription and regulation related DEPs. Regulator of σ70 Rsd functioning as a link between PTS-dependent carbon source utilization and the stringent response phosphocarrier protein HPr, which is one of two sugar-non-specific protein constituents of the PEP-PTS sugar [35], was upregulated by about 4.9- and 2.3-fold. Ybl162 as a LacI family transcriptional regulator predicted by automated computational analysis was upregulated by about 2.2- and 2.9-fold. MalM as the last gene of the malK-lamB-malM operon and part of the maltose regulon was upregulated by about 2.8- and 6.4-fold, consistent with the upregulation pattern of LamB. Anti-adapter protein IraP that can increase the stability of the sigma stress factor RpoS by inhibiting RpoS proteolysis was upregulated by about 3.6- and 2.0-fold. The upregulation pattern of these proteins suggested their possible roles in the regulation of levoglucosan metabolism; especially, YkgD that was highly induced and GalS and MhpR that are CRP-related proteins might directly contribute to the CCR of levoglucosan.
CRP is a global regulator and exhibits pleiotropic phenotypes by forming a complex with cAMP, and then the CRP–cAMP complex-mediated CCR makes E. coli cells preferentially metabolize glucose over fructose over xylose [36] and levoglucosan [20]. When the catabolite repressor/activator gene cra that negatively regulates the fru operon is deleted in E. coli, the mutant strain without repression of fru operon (FruAB and FruK) by glucose can co-utilize glucose and fructose [37]. The xylose-specific operons (xylE, xylFGHR, and xylAB) are under the regulation of XylR and cAMP-CRP-system regulator, and are also repressed by Mlc-regulated genes, including ptsG and manXYZ [38]. When fed with mixed sugars of glucose, arabinose, and xylose, E. coli cells first consume glucose, then arabinose, and finally xylose. Deleting gene ptsG makes E. coli co-utilize arabinose with glucose, although xylose utilization remains repressed by arabinose. Further attempts to replace the native crp gene with a cAMP-independent mutant without CCR can facilitate the simultaneous utilization of glucose, arabinose, and xylose [39]. A cis-acting DNA element known as the catabolite responsive element (cre) located within the open reading frame of xylA contributes to the CCR of xylose; accordingly, the strain with an inactivated cre site in xylA could consume fructose and xylose simultaneously [40], but this strain still exhibited diauxic growth on glucose and xylose. Therefore, CCR is a phenomenon resulting from many complex factors.
For the CCR involved in levoglucosan consumption, when glucose and fructose are absent in the culture media, adenylate cyclase (AC) can be activated by the phospho-form of glucose-specific PTS enzyme EIIAGlc, β-glucoside-specific PTS enzyme EIIABgl, and fructose-specific PTS enzyme EIIFru [27], thus improving the cellular cAMP level; then the formed cAMP–Crp complex will activate the transmembrane transporters responsible for levoglucosan uptake (Fig. 2). In addition, AC activity can also be regulated by a GTP-binding elongation factor Tu [41] and several uncharacterized regulatory factors (poorly defined X factors) that are required for the effective coupling of PTS proteins to AC [42,43,44]. Therefore, these poorly defined X factors might also contribute to the uptake of levoglucosan. In combination with our proteomics results, it is anticipated that the transcription and regulation-coupled proteins related to CCR like YkgD, GalS, and MhpR (Table 1), which might be the X factors, could improve our understanding of the biological regulation processes to relieve the CCR of levoglucosan utilization by further genetic manipulations.
RT-PCR results validated the reliability of DIA-based proteomics results
We also measured the transcriptional levels of 16 randomly selected DEPs described above at both early- and mid-log phases of levoglucosan metabolism using quantitative RT-PCR to validate the protein expression data obtained by DIA-based quantitative proteomics (Fig. 3). In all, the quantitative RT-PCR results for xylF, malE, ugpB, ugpC, mglA, kgtP, lamB, gntT, xylA, galS, malM, fruA, fruB, fruK, hyaA, viaA, and yahF are consistent with the relative quantitative protein expression results. The genes xylF, malE, ugpB, ugpC, mglA, kgtP, lamB, gntT, xylA, galS, and malM were all transcriptionally upregulated in levoglucosan-feeding cells compared to fructose-feeding cells, with the same expression direction to the protein expression results (Fig. 3). Of the upregulated genes, xylF, malE, kgtP, and xylA exhibited significantly higher fold changes in the transcript level than others, especially at the mid-log phase (p < 0.01). Moreover, the transcriptional levels of genes fruA, fruB, fruK, hyaA, viaA, and yahF were downregulated in levoglucosan-feeding cells (Fig. 3). Of these downregulated genes, the changes of fruA, fruB, and fruK in the transcript level were significant (p < 0.01), with a high fold-change ratio. Consequently, the quantitative RT-PCR results evidenced and strengthened the reliability of the relative quantitative protein expression results determined using DIA-based proteomics.
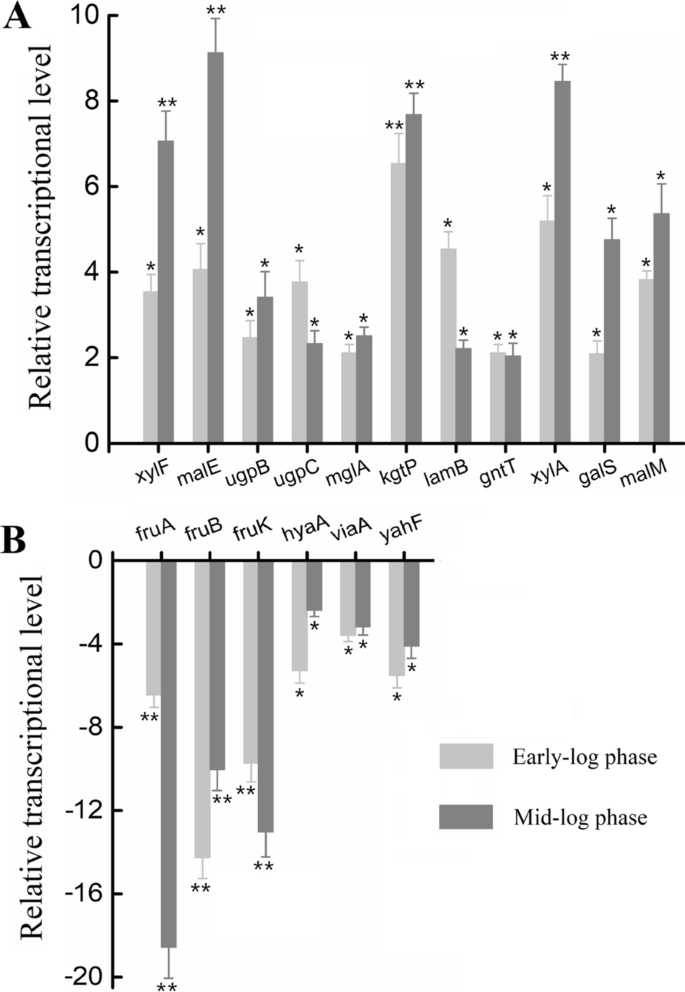
The relative transcriptional levels of several randomly-selected genes during levoglucosan utilization relative to fructose utilization. E. coli LGE2 cells were cultured at 37 °C and 150 rpm in levoglucosan- and fructose-based M9 minimal media, and then harvested at both the early- and mid-log phases. A The upregulated mRNAs. B The downregulated mRNAs. The light grey column denotes the mRNA was sampled at early-log phase, while the dark grey column denotes that at mid-log phase
Levoglucosan consumption was decreased by the deletion of genes kgtP and xylF while resumed by their complementation
Taking the proteomics and RT-PCR results together (mainly according to the fold change values of the protein and mRNA expression level), we proceeded to determine whether ABC transporter XylF and MFS transporter KgtP were related to levoglucosan uptake and metabolism, although it has been known that XylF is a ATP-dependent ABC xylose transporter [28] and KgtP is a proton-driven α-ketoglutarate transporter [45]. Based on the pCasPA/pACRISPR genome editing system, numerous colonies, in which the xylF or kgtP gene should be deleted, were successfully grown on the antibiotics screening plates. Due to the presence of the sucrose-inducing suicide gene SacB within the pCasPA and pACRISPR plasmids, both plasmids can be eliminated by sucrose selection, and then the randomly selected plasmid-eliminated colonies were re-verified by antibiotics (tetracycline and ampicillin) pressure and PCR (Additional file 2: Fig. S4) before sequencing. Our results showed that the genome editing system has higher efficiency in creating mutations than traditional methods, as 100% (10/10) of the randomly selected colonies were gene-deleted strains.
Furthermore, the utilization of different sugar substrates—levoglucosan and fructose (as a control) were investigated to determine the effects of xylF or kgtP deletion on levoglucosan as well as fructose utilization. The xylF-deleted strain E. coli ΔxylF, xylF-deleted and plasmid-borne lgk (levoglucosan kinase gene)-introduced strain E. coli ΔxylF + lgk, and xylF-complemented and lgk-introduced strain E. coli ΔxylF + lgk + xylF showed similar cell growth profiles and fructose-utilizing abilities to the parent strain E. coli BL21 and the lgk-introduced strain E. coli + lgk (Fig. 4A, B), implying that deletion of xylF had no apparent effect on the fructose utilization of the E. coli strain. In parallel, the kgtP-deleted and complemented E. coli strains ΔkgtP, ΔkgtP + lgk, and ΔkgtP + lgk + kgtP also showed no apparent discrepancies in cell growth and fructose utilization (Fig. 4A, B). However, in respect to the levoglucosan utilization, the levoglucosan consumption and cell growth of xylF/kgtP-deleted and lgk-introduced strains E. coli ΔxylF + lgk and ΔkgtP + lgk were both slower than that of the control strain E. coli + lgk; especially, the xylF-deleted strain E. coli ΔxylF + lgk showed a remarkably poor ability of levoglucosan consumption and cell growth (Fig. 4C, D). After a 16-h incubation, E. coli + lgk could consume all the levoglucosan and reach a maximum cell density (OD600) of 2.07 while E. coli ΔxylF + lgk and ΔkgtP + lgk could not; deletion of xylF and kgtP resulted in a levoglucosan residue of about 8.1 and 1.0 g/L, respectively (Fig. 4C, D). At the next sampling point (20 h), all the levoglucosan was utilized by E. coli ΔkgtP + lgk; however, E. coli ΔxylF + lgk still could not efficiently consume the levoglucosan, with about 6.9 g/L of levoglucosan remaining in the media. Furthermore, complementation of xylF and kgtP restored the destroyed genes and rendered the levoglucosan consumption and cell growth rates comparable to that of the control strain E. coli + lgk (Fig. 4C, D, and Table 3). These results showed that levoglucosan utilization was delayed by the separate deletion of both genes, indicating that both XylF and KgtP are related to the transport and metabolism of levoglucosan. However, XylF was more likely to be an effective levoglucosan transporter than KgtP, as deletion of xylF affected the levoglucosan consumption rate and growth of E. coli more significantly than deletion of kgtP (p < 0.01) (Table 3).

The time-course profiles of cell growth and sugar utilization of engineering and non-engineering E. coli. E. coli BL21 (DE3), E. coli (pET-lgk), E. coli ΔxylF, E. coli ΔkgtP, E. coli ΔxylF + lgk, E. coli ΔkgtP + lgk, E. coli ΔxylF + lgk + xylF, and E. coli ΔkgtP + lgk + kgtP were cultured at 37 °C and 150 rpm for 24 h in levoglucosan- and fructose-based M9 minimal media, respectively. E. coli (pET-lgk) is abbreviated to E. coli + lgk. A Fructose consumption and B Cell density (OD600) in fructose-feeding media. C Levoglucosan consumption and D cell density (OD600) in levoglucosan-feeding media. Downward arrows labeled in the figures highlighted the levoglucosan consumption and cell density exhibited by E. coli ΔxylF + lgk
Although we, for the first time, identified that XylF and KgtP, especially XylF, were related to the microbial levoglucosan utilization; currently, characterization of the enzymatic parameters of XylF and KgtP for levoglucosan uptake is still problematic because no method related to levoglucosan uptake has been developed so far. However, referring to the characterization of glucose/xylose transporters [46, 47], the isotope labeling method for characterization of levoglucosan transporter(s) would be a promising solution in the future study. Moreover, deletion of the two genes did not result in complete interruption of levoglucosan utilization (Fig. 4), implying that other unknown transporters for levoglucosan transport also exist. For the identification of specific transporter of levoglucosan, if it exists, further researches are also required.
Molecular docking showed levoglucosan could bind to XylF with relatively high affinity
Further molecular docking for modeling the binding of levoglucosan to XylF is shown in Fig. 5A. The binding energy (docking score) between XylF and levoglucosan is − 6.9 kJ/mol in the best binding conformation, suggesting levoglucosan could bind to XylF with relatively high affinity. There are six residues (Asp-90, Arg-91, Asp-135, Asn-137, Asn-196, and Lys-242) in XylF that can interact with levoglucosan by classical bidentate H-bonds (Fig. 5A and Additional file 2: Table S1). The bond length and angle of H-bond are important parameters, which represent the strength of affinity. In general, the shorter the bond length and the larger the bond angle, the stronger the bond strength. Among the H-bonds between XylF and levoglucosan, the H-bond between Asp-90 of XylF and levoglucosan had the shortest bond length (1.62 Å) and second largest bond angle (165.22°), while H-bond between Asp-135 and levoglucosan had the second shortest bond length (1.63 Å) and largest bond angle (171.72°) (Additional file 2: Table S1). In addition, Arg-91 had two H-bonds interacting with levoglucosan with respective 2.22 and 3.06 Å. This collectively implies the vital roles of Asp-90, Asp-135, and Arg-91 in the levoglucosan-binding active pocket of XylF.

The interaction diagram of XylF with levoglucosan (A) and xylose (B). The white cartoon model is the secondary structure of XylF, the yellow stick model is the key residue of XylF, the green stick model in A is levoglucosan skeleton and in B is xylose skeleton, the red stick model is oxygen, the thick blue stick model is nitrogen, and the thin blue stick model is H-bond
Because XylF is originally found to be able to bind to xylose, we further compared the binding conformation of xylose-XylF (Fig. 5B) to that of levoglucosan-XylF (Fig. 5A). In the closed xylose-XylF structure [48], there are twelve H-bonds (Fig. 5B) between xylose and the eight residues of XylF (Arg-16, Asp-90, Arg-91, Asp-135, Asn-137, Asn-196, Asp-222, and Lys-242), five H-bonds and two interactive residues more than those of levoglucosan-XylF. Different from the levoglucosan-XylF structure, Lys-242 of xylose makes two H-bonds with XylF with the shortest length of both 2.5 Å, followed by Asp-222 forming two H-bonds with respective 2.5 and 2.6 Å, and then Asp-135 forming one H-bond with 2.6 Å [48]. In addition, Arg-91 (2.9 and 3.0 Å) and Asn-137 (2.9 and 3.1 Å) also form two H-bonds with xylose, respectively [48]. Altogether, xylose and levoglucosan can bind to XylF within similar active pocket (Fig. 5), but the binding strength is different; although the number of H-bonds between levoglucosan and XylF is much less than that between xylose and XylF, the shorter H-bond lengths between levoglucosan and XylF might exhibit slightly weaker or comparable binding strength to that of the xylose-XylF structure. Notably, it is reported that the bacterial levoglucosan dehydrogenase from Pseudarthrobacter phenanthrenivorans can also catalyze the oxidation of xylose [10], implying a similarity between the cellular bioconversion of levoglucosan and xylose, although the relationship between them requires further studies. Therefore, the docking results together with the above gene editing results suggest that the xylose transport-related XylF is also a levoglucosan transport-related protein that would be modified by enzymatic engineering to achieve more effective utilization of levoglucosan to develop more robust levoglucosan-converting strains.
Conclusions
Our comparative proteomics analysis of levoglucosan and fructose utilization by engineered E. coli revealed many differentially expressed proteins related to carbohydrate transport and metabolism, transcription, regulation, etc. Especially, a total of ten ABC and MFS transporters were identified to be closely related to levoglucosan transport, and seven regulators were also speculated to be related to the CCR phenomenon of levoglucosan metabolism. Further gene knockout and complementation showed that transporters XylF and kgtP were both related to levoglucosan uptake and metabolism, while XylF that considerably affected the levoglucosan consumption and could bind to levoglucosan with strong H-bonds is more like a levoglucosan transporter. It is undeniable that any new screening laboratory results would need further attempts to proceed via the future study. We envision that the database generated by this study would promote a series of more profound researches devoting to the search and identification of more specific levoglucosan transporters as well as the regulation factors of CCR of levoglucosan, facilitating the development of more robust microbial strains for levoglucosan bioconversion to high value-added biofuels and chemicals.
Materials and methods
Microorganisms, plasmids, and culture conditions
All the strains and plasmids used in this study are listed in Table 4. The previously engineered levoglucosan-utilizing and ethanol-producing strain E. coli LGE2 [17] was used for proteomics analysis. E. coli DH5α was used for plasmid maintenance and BL21 (DE3) for plasmid transformation, gene expression, and gene knockout experiments. Plasmids pET-21a and pET-lgk were used for gene expression. Genome editing plasmids pCasPA and pACRISPR were purchased from the Addgene plasmid repository (Additional file 2: Figs. S5 and S6). The first-grade seed culture prepared from a single colony of E. coli strain was inoculated (1% v/v) into 100-mL levoglucosan-containing M9 minimal medium (7.1 g/L Na2HPO4, 3.0 g/L KH2PO4, 0.5 g/L NaCl, 1.0 g/L NH4Cl, 0.49 g/L MgSO4, 14.7 mg/L CaCl2, and 10.0 g/L levoglucosan). After incubating in a shaker at 37 °C and 150 rpm overnight, the second-grade seed culture was harvested at about 6 × 10⁸ cells/mL and used for subsequent experiments. Ampicillin, chloramphenicol, and tetracycline with respective final concentration of 100, 34, and 15 μg/mL were added into the media according to the antibiotic resistance of the strain used.
Samples preparation, proteins extraction, and peptides separation
The E. coli cells grown in M9 minimal medium supplied with either levoglucosan or fructose were harvested at both the early- and mid-logarithmic growth phase, with the respective OD600 value of 0.23 ± 0.02 and 0.57 ± 0.05 for proteomics analysis. The optical cell density was measured using a UV spectrophotometer (Unico Instrument Co., Ltd., Shanghai, China). All the experiments were conducted in triplicate. The harvested cells were washed and collected by centrifugation for protein extraction. The collected cells were lysed, reduced, alkylated, and digested as described previously [49]. The peptide mixture was fractionated by high pH reverse phase separation using LC-20AB HPLC system (Shimadzu, Japan) and then collected and dried in a vacuum concentrator (Christ RVC 2-25, Christ, Germany) for downstream analysis.
Spectral library generation
Data-dependent acquisition (DDA) analysis was performed on a Q Exactive HF mass spectrometer (Thermo Fisher Scientific, San Jose, California) equipped with an EASY-nLC 1200 system (Thermo Fisher Scientific, San Jose, California). Data were acquired with full scans (m/z 300–1400) using an Orbitrap mass analyzer. The top 20 precursor ions were fragmented and transferred into the Orbitrap analyzer operating at a resolution of 15,000 at m/z 200. The automatic gain control (AGC) was set to 3e6 for full MS and 5e4 for MS/MS, with maximum ion injection times of 80 and 100 ms, respectively. Dynamic exclusion was set at 1/2 of peak width. DIA analysis was performed using the same system and parameters for DDA. The DIA scans were set at a resolution of 30,000, NCE of 27%, AGC target of 1e6, and maximal injection time of 45 ms. Fifty windows were set for DIA acquisition, ranging from 400 to 1200 m/z, using an isolation width of 16 m/z.
Data analysis and bioinformatics analysis
Protein identification and quantification were conducted with the Spectronaut pulsar X 12.0 (Biognosys, Boston). First, the DDA raw files were searched in the Spectronaut pulsar against the E. coli BL21 (DE3) UniProt database (http://www.uniprot.org/uniprot/) to generate a spectral library using BGS factory settings. Peptides FDR was all set as 1%, and the iRT calibration R2 was 0.8. Next, the DIA data were analyzed for protein quantification. With the iRT regression typeset as local regression, all the results were filtered by a Q value cutoff of 0.01 (FDR of 0.01). The p value was estimated by Density Estimator and further adjusted by Bonferroni correction.
The paired difference test was used to identify DEPs. Proteins with log2FC > 1 or < − 1 (FC, fold change) and Bonferroni-adjusted p value < 0.05 were defined as DEPs. Functional enrichment of these DEPs was conducted by KEGG, GO, COG, and UniProt analysis.
Real-time quantitative PCR
To study the mRNA levels in response to different carbon and energy sources, qPCR was performed. RNA was isolated using the TRIzol (Takara) according to the manufacturer’s protocol, followed by treatment with DNase I. qPCR was performed using the real-time fluorescence detection method on an Applied Biosystems 7300 system. The qPCR reaction volume was 20 μL, containing 10 μL 2× SYBR Green Real-Time PCR Master Mix, 0.4 μL forward primer (10 μM), 0.4 μL reverse primer (10 μM), 1 μL template cDNA (20 ng/μL), and 8.2 μL ddH2O. The primer pairs used are listed in Additional file 2: Table S2. The qPCR condition was set as 2 min at 95 °C; 40 cycles of 15 s at 95 °C, 30 s at the respective annealing temperature (Additional file 2: Table S2), 25 s at 72 °C; followed by a melting curve for 15 s at 95 °C, 60 s at 60 °C, and finally for 15 s at 95 °C. Each sample was performed in triplicate. The 16 s rRNA gene was used as the endogenous housekeeping gene [50]. Data were analyzed using the 2−ΔΔCT method to evaluate the transcriptional fold change level, with the Ct threshold set automatically by the system for all samples.
Plasmid construction for the genome editing of E. coli BL21 (DE3)
A genome editing system coupled with the λ Red recombination system [51] was used to improve the mutation efficiency. A suitable 10-bp spacer sequence annealed by sgRNA primers listed in (Table 4) before the PAM site (NGG) of the target locus (xylF or kgtP) was chosen as the guide sequence for gene deletion using the online design tool (http://crispor.org). Then, the corresponding sgRNAs were synthesized by Sangon Biotech (Shanghai) Co., Ltd, and subsequently phosphorylated, annealed, and inserted into the BsaI sites of the pACRISPR plasmid to generate the pACRISPR-sgRNA plasmids. About 500-bp sequence (designed as left homologous arm) upstream of 5’ end of the gene xylF or kgtP was amplified using restriction sites-containing primer pairs F3/R3 or F5/R5 (Table 4). The resulting left homologous arm was flanked by XbaI and NdeI–XhoI sites, in which the NdeI site was intentionally introduced in the system because restriction sites in the original pACRISPR plasmid are limited. Then, about 500-bp sequence (designed as right homologous arm) downstream of 3′ end of the gene xylF or kgtP was amplified using primer pairs F4/R4 or F6/R6. The resulting right homologous arm was flanked by NdeI and XhoI sites. The left and right homologous arms were sequentially inserted into the corresponding pACRISPR-sgRNA plasmids to generate pACRISPR-sgRNA-HRxylF and pACRISPR-sgRNA-HRkgtP plasmids, respectively, which were used for the efficient deletion of genes xylF and kgtP of E. coli BL21 (DE3). Competent cells of E. coli were prepared by the CaCl2 method. PCR amplification, plasmid DNA extraction, DNA ligation was executed according to previously described procedures [17].
Gene knockout using the pCasPA/pACRISPR system
At least 1 μg of pCasPA plasmid was transformed into 100 μL E. coli BL21 (DE3) competent cells using electroporation with the parameters of 1100 V, 400 Ω, 6 μF, and 2 mm cuvette of a Scientz-2C gene pulser. The pCasPA-containing colony was selected on LB agar plates added with 15 μg/mL tetracycline, confirmed by PCR, and cultured in the LB medium at 37 °C and 150 rpm. Once the OD600 of the culture reached about 0.2, a final concentration of 30 mM l-arabinose was added to the culture to induce the expression of the Cas9 nuclease and the λ-Red system. After another 2-h incubation, the culture was harvested to prepare the competent cells. Next, the pACRISPR-sgRNA-HRxylF and pACRISPR-sgRNA-HRkgtP plasmids assembled with the spacer and repair template were electroporated into the competent cells. Transformed cells were recovered in LB media at 37 °C for 1 h and plated onto the LB agar plate containing 15 μg/mL tetracycline and 100 μg/mL ampicillin. PCR and sequencing were used to verify the mutants and evaluate the genome editing efficiency. The successful knockout strains of xylF and kgtP were named E. coli ΔxylF and E. coli ΔkgtP, respectively.
Gene restoration of xylF and kgtP in the mutated E. coli
The plasmid pET-lgk previously constructed in our laboratory [17], was used as the donor of gene lgk, and to restore genes xylF and kgtP. Gene xylF was amplified from E. coli BL21 (DE3) genomic DNA using primers F7 and R7 containing BamHI/EcoRI restriction sites (Table 4). Then, the sequenced xylF fragment was digested with BamHI/EcoRI and cloned into the pET-lgk plasmid to generate a pET-xylF-lgk plasmid. In this process, the ribosome binding site sequence corresponding to the T7lac promoter was added to the 3′ downstream of xylF. Gene kgtP was also amplified from E. coli BL21 (DE3) using primers F8 and R8 (Table 4). The construction of the pET-kgtP-lgk plasmid followed the same procedure as that of the pET-xylF-lgk plasmid. Finally, the pET-xylF-lgk and pET-kgtP-lgk plasmids were introduced into the competent cells of E. coli ΔxylF and ΔkgtP, respectively, to generate the gene-restored strains E. coli ΔxylF + lgk + xylF and E. coli ΔkgtP + lgk + kgtP. In parallel, pET-lgk plasmid was introduced into the competent cells of E. coli ΔxylF and E. coli ΔkgtP, respectively, to generate control strains E. coli ΔxylF + lgk and E. coli ΔkgtP + lgk to test the effect of xylF or kgtP deletion on sugar substrate utilization, especially the levoglucosan utilization.
Cell growth and sugars utilization tests
Escherichia coli BL21 (DE3), E. coli (pET-lgk), E. coli ΔxylF, E. coli ΔkgtP, E. coli ΔxylF + lgk, E. coli ΔkgtP + lgk, E. coli ΔxylF + lgk + xylF, E. coli ΔkgtP + lgk + kgtP strains were individually inoculated into 100-mL M9 minimum media supplemented with 1% (w/v) levoglucosan and fructose, respectively. For each time interval, 5-mL culture media were taken and centrifuged to separate the cells and supernatants. E. coli cells were pelleted by centrifugation at 6000 rpm for 5 min, washed twice, and then re-suspended in 5-mL ice-cold water. Cell density was detected by a UV-2000 spectrophotometer set at λ = 600 nm. After centrifugation, the harvested cell pellets were placed in an oven set at 70 °C to determine the dry cell weights; the clarified supernatants were used for sugar analysis.
Molecular docking of ABC transporter XylF and levoglucosan
Lamarckian genetic algorithm of AutoDock 4.2 software was used for molecular docking. The structure file of target protein XylF was obtained from PDB database (PDB_ID: 3MA0), and the structure file of target sugar levoglucosan was drawn by Chem3D software. The AutoDock software was used to add H atoms, add Gasteiger-Hücker empirical charges, combine non-polar hydrogen and set rotatable bonds. σ bonds between heavy atoms in the structure of levoglucosan were all set as rotatable bonds, and XylF was regarded as rigid structures. During the docking process, a 60 × 60 × 60-step docking square box (step length 0.375 Å) was set at the binding site of XylF, and levoglucosan was independently docked at the binding site for 200 times. Lamarckian genetic algorithm generated 150 random orientation and random small molecule conformations, and each round of passage was optimized for up to 1,500,000 times of energy optimization. The optimal ten conformations were selected for passage, the gene exchange rate of passage was 0.8 and the mutation rate was 0.02. The calculation was terminated after 27,000 generations of optimization. Other parameters used to run the program were set to default values in AutoDock 4.2 software. After docking, cluster analysis of the 200 docking results was performed, and the binding conformation with the best docking score (the lowest scoring value) was selected from the optimal cluster, to determine the binding site and binding mode of XylF and levoglucosan.
Analytical method
Analyses of fructose and levoglucosan were performed using a high-performance liquid chromatography system (HPLC, LC-20AT, Shimadzu Corporation) described previously [2]. The specific growth rate μ was calculated using the dry cell weights detected at different time points [17]. Three replicate samples were evaluated in each case. All reagents used in this study were of analytical grade.
Availability of data and materials
The datasets used and/or analyzed during the current study are available from the corresponding author on reasonable request.
Abbreviations
- ABC:
-
ATP-binding cassette
- MFS:
-
Major facility superfamily
- LGK:
-
Levoglucosan kinase
- CCR:
-
Carbon catabolite repression
- DEPs:
-
Differentially expressed proteins
- DDA:
-
Data-dependent acquisition
- DIA:
-
Data-independent acquisition
- KEGG:
-
Kyoto Encyclopedia of Genes and Genomes
- GO:
-
Gene Ontology
- COG:
-
Cluster of Orthologous Groups
- A:
-
Cells treated by acetic acid
- F:
-
Cells treated by furfural
- P:
-
Cells treated by phenol
- C:
-
Cells treated by combined inhibitors
- MIC:
-
Minimum inhibitory concentration
- OD600 :
-
Optical density at wavelength (λ) 600 nm
- HPLC:
-
High-performance liquid chromatography
- G6P:
-
Glucose-6-phosphate
- PEP:
-
Phosphoenolpyruvate
- PTS:
-
Phosphotransferase system
- F1P:
-
Fructose 1-phosphate
- F6P:
-
Fructose 6-phosphate
- CRP:
-
Cyclic AMP receptor protein
References
Kim JS, Lee Y, Kim TH. A review on alkaline pretreatment technology for bioconversion of lignocellulosic biomass. Bioresour Technol. 2016;199:42–8.
Chang D, Yu Z, Islam ZU, Zhang H. Mathematical modeling of the fermentation of acid-hydrolyzed pyrolytic sugars to ethanol by the engineered strain Escherichia coli ACCC 11177. Appl Microbiol Biotechnol. 2015;99:4093–105.
Islam ZU, Zhisheng Y, El Hassan B, Dongdong C, Hongxun Z. Microbial conversion of pyrolytic products to biofuels: a novel and sustainable approach toward second-generation biofuels. J Ind Microbiol Biot. 2015;42:1557–79.
Anex RP, Aden A, Kazi FK, Fortman J, Swanson RM, Wright MM, Satrio JA, Brown RC, Daugaard DE, Platon A. Techno-economic comparison of biomass-to-transportation fuels via pyrolysis, gasification, and biochemical pathways. Fuel. 2010;89:S29–35.
Iwazaki S, Hirai H, Hamaguchi N, Yoshida N. Isolation of levoglucosan-utilizing thermophilic bacteria. Sci Rep. 2018;8:4066.
Ning J, Yu Z, Xie H, Zhang H, Zhuang G, Bai Z, Yang S, Jiang Y. Purification and characterization of levoglucosan kinase from Lipomyces starkeyi YZ-215. World J Microb Biotechnol. 2008;24:15–22.
Bacik JP, Jarboe LR. Bioconversion of anhydrosugars: emerging concepts and strategies. IUBMB Life. 2016;68:700–8.
Kitamura Y, Yasui T. Purification and some properties of levoglucosan (1,6-anhydro-β-d-glucopyranose) kinase from the yeast Sporobolomyces salmonicolor. Agric Biol Chem. 1991;55:523–9.
Xie H, Zhuang X, Bai Z, Qi H, Zhang H. Isolation of levoglucosan-assimilating microorganisms from soil and an investigation of their levoglucosan kinases. World J Microb Biotechnol. 2006;22:887–92.
Sugiura M, Nakahara M, Yamada C, Arakawa T, Kitaoka M, Fushinobu S. Identification, functional characterization, and crystal structure determination of bacterial levoglucosan dehydrogenase. J Biol Chem. 2018;293:17375–86.
Nakahara K, Kitamura Y, Yamagishi Y, Shoun H, Yasui T. Levoglucosan dehydrogenase involved in the assimilation of levoglucosan in Arthrobacter sp. I-552. Biosci Biotechnol Biochem. 1994;58:2193–6.
Dai J, Yu Z, He Y, Zhang L, Bai Z, Dong Z, Du Y, Zhang H. Cloning of a novel levoglucosan kinase gene from Lipomyces starkeyi and its expression in Escherichia coli. World J Microb Biot. 2009;25:1589–95.
Kim EM, Um Y, Bott M, Woo HM. Engineering of Corynebacterium glutamicum for growth and succinate production from levoglucosan, a pyrolytic sugar substrate. FEMS Microbiol Lett. 2015. https://doi.org/10.1093/femsle/fnv161.
Linger JG, Hobdey SE, Franden MA, Fulk EM, Beckham GT. Conversion of levoglucosan and cellobiosan by Pseudomonas putida KT2440. Metab Eng Commun. 2016;3:24–9.
Xiong X, Lian J, Yu X, Garcia-Perez M, Chen S. Engineering levoglucosan metabolic pathway in Rhodococcus jostii RHA1 for lipid production. J Ind Microbiol Biotechnol. 2016;43:1551–60.
Layton DS, Ajjarapu A, Choi DW, Jarboe LR. Engineering ethanologenic Escherichia coli for levoglucosan utilization. Bioresour Technol. 2011;102:8318–22.
Chang D, Islam ZU, Yang Z, Thompson IP, Yu Z. Conversion efficiency of bioethanol from levoglucosan was improved by the newly engineered Escherichia coli. Environ Prog Sustain Energy. 2021. https://doi.org/10.1002/ep.13687.
Klesmith JR, Bacik JP, Michalczyk R, Whitehead TA. Comprehensive sequence-flux mapping of a levoglucosan utilization pathway in E. coli. ACS Synth Biol. 2015;4:1235–43.
Chi Z, Rover M, Jun E, Deaton M, Johnston P, Brown RC, Wen Z, Jarboe LR. Overliming detoxification of pyrolytic sugar syrup for direct fermentation of levoglucosan to ethanol. Bioresour Technol. 2013;150:220–7.
Rover MR, Johnston PA, Jin T, Smith RG, Brown RC, Jarboe L. Production of clean pyrolytic sugars for fermentation. ChemSusChem. 2014;7:1662–8.
Qiu X, Zhang H, Lai Y. Quantitative targeted proteomics for membrane transporter proteins: method and application. AAPS J. 2014;16:714–26.
Deracinois B, Flahaut C, Duban-Deweer S, Karamanos Y. Comparative and quantitative global proteomics approaches: an overview. Proteomes. 2013;1:180–218.
Wang Y-F, Dutzler R, Rizkallah PJ, Rosenbusch JP, Schirmer T. Channel specificity: structural basis for sugar discrimination and differential flux rates in maltoporin. J Mol Biol. 1997;272:56–63.
Meyenburg KV, Nikaido H. Outer membrane of Gram-negative bacteria. XVII. Specificity of transport process catalyzed by the λ-receptor protein in Escherichia coli. Biochem Biophys Res Commun. 1977;78:1100–7.
Tanimura K, Matsumoto T, Nakayama H, Tanaka T, Kondo A. Improvement of ectoine productivity by using sugar transporter-overexpressing Halomonas elongata. Enzyme Microb Technol. 2016;89:63–8.
Aboulwafa M, Zhang Z, Saier MH Jr. Protein:protein interactions in the cytoplasmic membrane apparently influencing sugar transport and phosphorylation activities of the E. coli phosphotransferase system. PLoS ONE. 2019;14: e0219332.
Luo Y, Zhang T, Wu H. The transport and mediation mechanisms of the common sugars in Escherichia coli. Biotechnol Adv. 2014;32:905–19.
Ahlem C, Huisman W, Neslund G, Dahms AS. Purification and properties of a periplasmic d-xylose-binding protein from Escherichia coli K-12. J Biol Chem. 1982;257:2926–31.
Dos Reis TF, De Lima PBA, Parachin NS, Mingossi FB, de Castro Oliveira JV, Ries LNA, Goldman GH. Identification and characterization of putative xylose and cellobiose transporters in Aspergillus nidulans. Biotechnol Biofuels. 2016;9:1–19.
Colabardini A, Ries LN, Brown N, Dos Reis T, Savoldi M, Goldman MHS, Menino JO, Rodrigues F, Goldman G. Functional characterization of a xylose transporter in Aspergillus nidulans. Biotechnol Biofuels. 2014;7:1–19.
Zhang Z, Aboulwafa M, Saier MH. Regulation of crp gene expression by the catabolite repressor/activator, Cra, in Escherichia coli. J Mol Microbiol Biotechnol. 2014;24:135–41.
Weickert MJ, Adhya S. Control of transcription of gal repressor and isorepressor genes in Escherichia coli. J Bacteriol. 1993;175:251–8.
Torres B, Porras G, García JL, Díaz E. Regulation of the mhp cluster responsible for 3-(3-hydroxyphenyl) propionic acid degradation in Escherichia coli. J Biol Chem. 2003;278:27575–85.
Parker BW, Schwessinger EA, Jakob U, Gray M. The RclR protein is a reactive chlorine-specific transcription factor in Escherichia coli. J Biol Chem. 2013;288:32574–84.
Lee J-W, Park Y-H, Seok Y-J. Rsd balances (p) ppGpp level by stimulating the hydrolase activity of SpoT during carbon source downshift in Escherichia coli. PNAS. 2018;115:E6845–54.
Park JM, Vinuselvi P, Lee SK. The mechanism of sugar-mediated catabolite repression of the propionate catabolic genes in Escherichia coli. Gene. 2012;504:116–21.
Clark B, Holms WH. Control of the sequential utilization of glucose and fructose by Escherichia coli. J Gen Microbiol. 1976;95:191–201.
Song S, Park C. Organization and regulation of the d-xylose operons in escherichia coli K-12: XylR acts as a transcriptional activator. J Bacteriol. 1997;179(22):7025–32.
Jojima T, Inui M, Yukawa H. Metabolic engineering of bacteria for utilization of mixed sugar substrates for improved production of chemicals and fuel ethanol. Biofuels. 2011;2:303–13.
Schmiedel D, Hillen W. Contributions of XylR CcpA and cre to diauxic growth of Bacillus megaterium and to xylose isomerase expression in the presence of glucose and xylose. Mol Gen Genet. 1996;250:259–66.
Reddy P, Miller D, Peterkofsky A. Stimulation of Escherichia coli adenylate cyclase activity by elongation factor Tu, a GTP-binding protein essential for protein synthesis. J Biol Chem. 1986;261:11448–51.
Reddy P, Meadow N, Peterkofsky RA. Reconstitution of regulatory properties of adenylate cyclase in Escherichia coli extracts. Proc Natl Acad Sci USA. 1985;82:8300–4.
Neidhardt FC. Escherichia coli and Salmonella cellular and molecular biology. Washington, D.C: American Society for Microbiology; 1996.
Park YH, Lee BR, Seok YJ, Peterkofsky A. In vitro reconstitution of catabolite repression in Escherichia coli. J Biol Chem. 2006;281:6448–54.
Seol W, Shatkin AJ. Escherichia coli alpha-ketoglutarate permease is a constitutively expressed proton symporter. J Biol Chem. 1992;267:6409.
Jiang Y, Shen Y, Gu L, Wang Z, Fang X. Identification and characterization of an efficient d-xylose transporter in Saccharomyces cerevisiae. J Agr Food Chem. 2020;68:2702–10.
Leandro M, GonAlves P, Spencer-Martins I. Two glucose/xylose transporter genes from the yeast Candida intermedia: first molecular characterization of a yeast xylose-H+ symporter. Biochem J. 2006;395:543.
Sooriyaarachchi S, Ubhayasekera W, Park C, Mowbray SL. Conformational changes and ligand recognition of Escherichia coli d-xylose binding protein revealed. J Mol Biol. 2010;402:657–68.
Chang D, Yu Z, Ul Islam Z, French WT, Zhang Y, Zhang H. Proteomic and metabolomic analysis of the cellular biomarkers related to inhibitors tolerance in Zymomonas mobilis ZM4. Biotechnol Biofuels. 2018;11:283.
Tschirhart T, Kim E, Mckay R, Ueda H, Bentley WE. Electronic control of gene expression and cell behaviour in Escherichia coli through redox signalling. Nat Commun. 2017;8:14030.
Chen W, Zhang Y, Zhang Y, Pi Y, Gu T, Song L, Yu W, Ji Q. CRISPR/Cas9-based genome editing in Pseudomonas aeruginosa and cytidine deaminase-mediated base editing in Pseudomonas species. iScience. 2018;6:222–31.
Acknowledgements
The authors gratefully acknowledge the financial support of the National Natural Science Foundation of China (Grant No. 21978287) and the Fundamental Research Funds for the Central Universities (Y954035XX2).
Funding
Funding was provided by the National Natural Science Foundation of China (Grant No. 21978287) and the Fundamental Research Funds for the Central Universities (Y954035XX2).
Author information
Authors and Affiliations
Contributions
DC: conceptualization, methodology, writing original draft, visualization. CW: methodology, visualization. ZUI: data curation, writing review and editing. ZY: conceptualization, supervision, writing review and editing. All authors read and approved the final manuscript.
Corresponding author
Ethics declarations
Ethics approval and consent to participate
Not applicable.
Consent for publication
All authors consented to the publication of this work.
Competing interests
The authors declare that they have no competing interests.
Additional information
Publisher's Note
Springer Nature remains neutral with regard to jurisdictional claims in published maps and institutional affiliations.
Supplementary Information
Additional file 1.
A total of 2749 proteins identified in the study.
Additional file 2: Text S1.
Detailed analysis of the distribution and enrichment of the DEPs based on GO and KEGG analysis, respectively. Text S2. Proteins involved in carbohydrate metabolism and energy production were significantly differentially expressed. Table S1. Parameters of hydrogen bond length and angle between levoglucosan and XylF. Table S2. Primers used in the qPCR experiments. Figure S1. The distribution and enrichment of DEPs based on Gene Ontology (GO). Figure S2. Enrichment of KEGG pathway for the DEPs at early-log phase (A) and mid-log phase (B). Figure S3. The protein–protein interactions and involved biological processes of the DEPs related to carbonhydrate metabolism and energy production and conversion. Figure S4. Plates screening and PCR verification of the gene knockout strains. Figure S5. Map of plasmid pCasPA. Figure S6. Map of plasmid pACRISPR.
Rights and permissions
Open Access This article is licensed under a Creative Commons Attribution 4.0 International License, which permits use, sharing, adaptation, distribution and reproduction in any medium or format, as long as you give appropriate credit to the original author(s) and the source, provide a link to the Creative Commons licence, and indicate if changes were made. The images or other third party material in this article are included in the article's Creative Commons licence, unless indicated otherwise in a credit line to the material. If material is not included in the article's Creative Commons licence and your intended use is not permitted by statutory regulation or exceeds the permitted use, you will need to obtain permission directly from the copyright holder. To view a copy of this licence, visit http://creativecommons.org/licenses/by/4.0/. The Creative Commons Public Domain Dedication waiver (http://creativecommons.org/publicdomain/zero/1.0/) applies to the data made available in this article, unless otherwise stated in a credit line to the data.
About this article

Cite this article
Chang, D., Wang, C., Ul Islam, Z. et al. Omics analysis coupled with gene editing revealed potential transporters and regulators related to levoglucosan metabolism efficiency of the engineered Escherichia coli. Biotechnol Biofuels 15, 2 (2022). https://doi.org/10.1186/s13068-022-02102-4
Received:
Accepted:
Published:
DOI: https://doi.org/10.1186/s13068-022-02102-4